Atmospheric CO2
I'm still looking for DATA on the new CO2 measures back 650,000 in ice cores in Dome C in Antarctica.
Articles are nice, but graphics is BETTER:
http://www.sciam.com/article.cfm?articleID=00020983-B238-1384-B23883414B7F0000 Ice Core Extends Climate Record Back 650,000 Years
While I wait, I thought I'd upload some graphs I made for a 2003 speech on CO2.
1. Recent CO2: 1958-2001 (Measured from Mauna Loa, Hawaii)
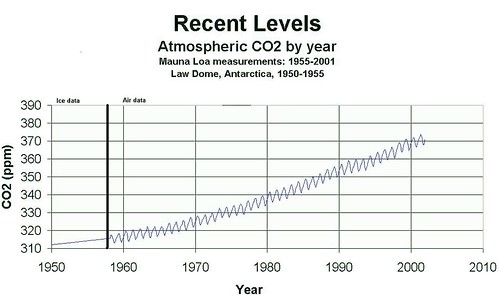
Here you can see seasonal varitions from monthly measurements on a steady track upwards i the last 50 years.
2. Historical levels: 3000BC to present:
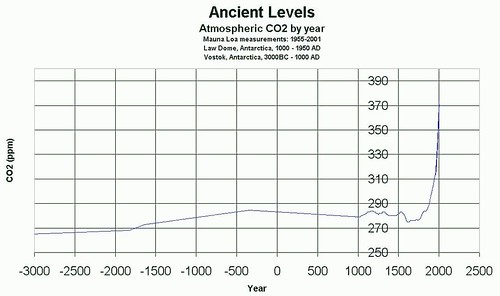
Here you can see lower resolution data over the last 5000 years, showing CO2 to be fairly constant before 1900, and an EXTREMELY short upswing since. (Coinciding with our vastly increased burning of fossil fuels!)
You can't necessarily say how smooth the data is over 5000 years since we don't have a lot of data points, but clearly "something's happening" recently that is new.
3. 418,000 BP to present:
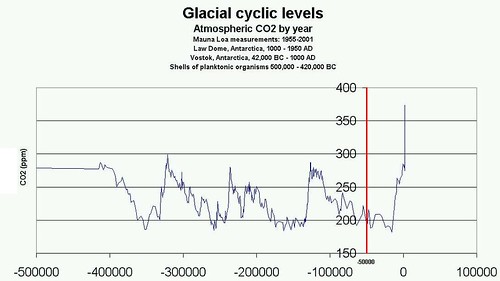
Here you can see the "recent" climb from 280 to 380 ppm is added ON TOP of a previous quick rise from 15000 BC to 8000BC (180-270ppm), a 50% rise, but that took 7000 years!
Looking further back you can see four more distant "peaks" corresponding to "pre-industrial levels around 280ppm. Each of these "peaks" is a "short" ~5000-20,000 year warm interglacial period with the majority of CO2 levels much lower between the peaks, corrsponding to glacial periods where the earth was colder.
In fact evidence suggests the last 1.6 million years (of our species' evolution) has been mostly a cold glacial period with short warm interglacial periods.
4. Atmospheric carbon dioxide concentrations over the past 60 million years PAUL N. PEARSON AND MARTIN R. PALMER [Nature 406, 695 - 699 (August 17, 2002)] (0-25Mya, 40-60Mya)
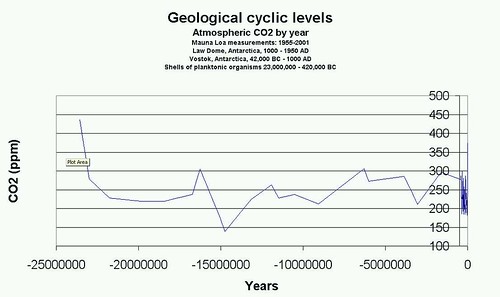
This graph shows data back much further, to 23 million years ago and with the limited data points, atmospheric CO2 has been between 145-305 ppm over the last 22 million years. Although just a bit further back we hit ONE data point around 440ppm (higher than our 380ppm now)
Given the earth is 4.3 billion years old, this data is still barely 5% of the earth's history and not even "half-way" back to the dinosaurs extinction!
Not much can be said (by me about this data), except that at least by the measure of CO2 over 100 years Humanity has causes large changes much faster than geological processes cause.
I'm reluctant to get into the "global warming" debate, not because I don't believe it, just prefer to be cautious and not overstate the evidence, at least for CO2.
The thing is we know without humanity, there is a pretty clear correlation between global temperature averages and atmospheric CO2 levels. However we don't have any prehistorical data of the burning of massive amounts of fossil fuels in a short period of time.
Some anti-global warming opinions like to state that human sources of Atmospheric CO2 are only a small fraction of nonhuman sources. I can discount this argument because the "natural carbon cycle" works as a semiclosed cycle on an annual basis - plants take in CO2 when they grow and release it (via microbial decay) when they decompose. The CO2 we're creating is coming from plant matter that DID not decay in an Oxygen environment millions of years ago. So we're adding prehistoric carbon to the atmosphere (and oceans), and we don't know how well the carbon cycle will readjust to our additions. Well, ALSO, some of the CO2 rise is NOT be due to fossil fuel burning, but deforestation, like the rain forests.
So if we STOP burning fossil fuels, and wait 1000 years, it COULD be natural systems will take up the extra CO2 in a net increased living plant matter. On the other hand, CO2 levels might keep rising much longer even without new input from us, just a result of our deforestation. Then again, perhaps a negative feedback mechanism (like increased clouds) might cool the earth despite the higher CO2 and we might fall back towards a glacial period. In short, I don't think we have a clue what can happen whatever we do.
When I first saw the Mauna Loa CO2 graphics from 1958, I thought it was a clear sign of humanity's effect on the environment, and I believe that still, BUT I just can't convince myself we know much how the system will respond to our fossil fuel burning and deforestation.
Incidentally, I read "today" (December 3) is The Climate Crisis Coalition Action Day (To coincide with the UN Climate talks in Montreal, November 28th-December 9th )
http://www.climatecrisiscoalition.org/
http://www.globalpublicmedia.com/interviews/571
Climate Crisis might be a better term than global warming, but both seem less that clear to me.
There's a demonstration Saturday at noon at the Governor's mansion in St Paul. I considered going, but lots else to do, and I'm not focused well enough to think it'll make a difference to me.
I like the goals of the Kyoto Protocol and with the U.S. would support it. I think it's in our best interest in every way (except short term convenience) to move every which way we can if it is away from burning fossil fuels. I'm fully skeptical that capitalism and market mechanisms and "voluntary action" is sufficient to even halt our ever increased energy consumption, much less reverse it. Only shortages of cheap energy seem believable mechanisms. So either natural shortages will occur OR the government can create artificial shortages via limiting imports of petroleum, NLG. Okay, I'd listen to "Carbon taxes" as well, but that's just an accounting method of creation artificial shortages.
Well, it'll be interesting to see more CO2 graphs before 440,000 BP.
Best I've seen (for graphics) is at:
http://www.ncdc.noaa.gov/paleo/pubs/epica2004/epica2004.html

http://www.ncdc.noaa.gov/paleo/pubs/epica2004/epica2004.html
http://www.ncdc.noaa.gov/paleo/icecore/antarctica/domec/domec_epica_data.html
Not CO2 data though...
... AH NEW DATA?
ftp://ftp.ncdc.noaa.gov/pub/data/paleo/icecore/antarctica/epica_domec/edc-co2-650k-390k.txt
... hold it a moment!!!
Articles are nice, but graphics is BETTER:
http://www.sciam.com/article.cfm?articleID=00020983-B238-1384-B23883414B7F0000 Ice Core Extends Climate Record Back 650,000 Years
While I wait, I thought I'd upload some graphs I made for a 2003 speech on CO2.
1. Recent CO2: 1958-2001 (Measured from Mauna Loa, Hawaii)
Here you can see seasonal varitions from monthly measurements on a steady track upwards i the last 50 years.
2. Historical levels: 3000BC to present:
Here you can see lower resolution data over the last 5000 years, showing CO2 to be fairly constant before 1900, and an EXTREMELY short upswing since. (Coinciding with our vastly increased burning of fossil fuels!)
You can't necessarily say how smooth the data is over 5000 years since we don't have a lot of data points, but clearly "something's happening" recently that is new.
3. 418,000 BP to present:
Here you can see the "recent" climb from 280 to 380 ppm is added ON TOP of a previous quick rise from 15000 BC to 8000BC (180-270ppm), a 50% rise, but that took 7000 years!
Looking further back you can see four more distant "peaks" corresponding to "pre-industrial levels around 280ppm. Each of these "peaks" is a "short" ~5000-20,000 year warm interglacial period with the majority of CO2 levels much lower between the peaks, corrsponding to glacial periods where the earth was colder.
In fact evidence suggests the last 1.6 million years (of our species' evolution) has been mostly a cold glacial period with short warm interglacial periods.
4. Atmospheric carbon dioxide concentrations over the past 60 million years PAUL N. PEARSON AND MARTIN R. PALMER [Nature 406, 695 - 699 (August 17, 2002)] (0-25Mya, 40-60Mya)
This graph shows data back much further, to 23 million years ago and with the limited data points, atmospheric CO2 has been between 145-305 ppm over the last 22 million years. Although just a bit further back we hit ONE data point around 440ppm (higher than our 380ppm now)
Given the earth is 4.3 billion years old, this data is still barely 5% of the earth's history and not even "half-way" back to the dinosaurs extinction!
Not much can be said (by me about this data), except that at least by the measure of CO2 over 100 years Humanity has causes large changes much faster than geological processes cause.
I'm reluctant to get into the "global warming" debate, not because I don't believe it, just prefer to be cautious and not overstate the evidence, at least for CO2.
The thing is we know without humanity, there is a pretty clear correlation between global temperature averages and atmospheric CO2 levels. However we don't have any prehistorical data of the burning of massive amounts of fossil fuels in a short period of time.
Some anti-global warming opinions like to state that human sources of Atmospheric CO2 are only a small fraction of nonhuman sources. I can discount this argument because the "natural carbon cycle" works as a semiclosed cycle on an annual basis - plants take in CO2 when they grow and release it (via microbial decay) when they decompose. The CO2 we're creating is coming from plant matter that DID not decay in an Oxygen environment millions of years ago. So we're adding prehistoric carbon to the atmosphere (and oceans), and we don't know how well the carbon cycle will readjust to our additions. Well, ALSO, some of the CO2 rise is NOT be due to fossil fuel burning, but deforestation, like the rain forests.
So if we STOP burning fossil fuels, and wait 1000 years, it COULD be natural systems will take up the extra CO2 in a net increased living plant matter. On the other hand, CO2 levels might keep rising much longer even without new input from us, just a result of our deforestation. Then again, perhaps a negative feedback mechanism (like increased clouds) might cool the earth despite the higher CO2 and we might fall back towards a glacial period. In short, I don't think we have a clue what can happen whatever we do.
When I first saw the Mauna Loa CO2 graphics from 1958, I thought it was a clear sign of humanity's effect on the environment, and I believe that still, BUT I just can't convince myself we know much how the system will respond to our fossil fuel burning and deforestation.
Incidentally, I read "today" (December 3) is The Climate Crisis Coalition Action Day (To coincide with the UN Climate talks in Montreal, November 28th-December 9th )
http://www.climatecrisiscoalition.org/
http://www.globalpublicmedia.com/interviews/571
Climate Crisis might be a better term than global warming, but both seem less that clear to me.
There's a demonstration Saturday at noon at the Governor's mansion in St Paul. I considered going, but lots else to do, and I'm not focused well enough to think it'll make a difference to me.
I like the goals of the Kyoto Protocol and with the U.S. would support it. I think it's in our best interest in every way (except short term convenience) to move every which way we can if it is away from burning fossil fuels. I'm fully skeptical that capitalism and market mechanisms and "voluntary action" is sufficient to even halt our ever increased energy consumption, much less reverse it. Only shortages of cheap energy seem believable mechanisms. So either natural shortages will occur OR the government can create artificial shortages via limiting imports of petroleum, NLG. Okay, I'd listen to "Carbon taxes" as well, but that's just an accounting method of creation artificial shortages.
Well, it'll be interesting to see more CO2 graphs before 440,000 BP.
Best I've seen (for graphics) is at:
http://www.ncdc.noaa.gov/paleo/pubs/epica2004/epica2004.html
http://www.ncdc.noaa.gov/paleo/pubs/epica2004/epica2004.html
http://www.ncdc.noaa.gov/paleo/icecore/antarctica/domec/domec_epica_data.html
Not CO2 data though...
... AH NEW DATA?
ftp://ftp.ncdc.noaa.gov/pub/data/paleo/icecore/antarctica/epica_domec/edc-co2-650k-390k.txt
... hold it a moment!!!
posted by Ares Olympus at 11:13 PM
![]()

0 Comments:
Post a Comment
<< Home